The Ultimate Guide to Ecommerce Customer Service in 2026


Meet Sarah.
She just abandoned her third shopping cart this week because she couldn't find answers to her questions about shipping and product sizing.
She's not alone. With new ecommerce brands launching every hour, customers have endless options and zero patience.
The brands winning Sarah's business aren't necessarily offering the lowest prices or fastest shipping. They're winning through what is both simpler and harder to execute: ecommerce customer service that makes people feel valued and a seamless shopping experience.
What is ecommerce customer service?
Ecommerce customer service is the support you provide to your customers before, during, and after they make a purchase from your online store. It includes everything from answering pre-sale questions to resolving issues with delivery, product quality, warranties, returns, and exchanges.
Whether helping a customer choose the right size or replacing a damaged item, great ecommerce customer service turns casual shoppers into loyal customers — and loyal customers into brand advocates.
Why ecommerce customer service matters now more than ever
You might wonder: If my product is great and I invest heavily in marketing, isn’t that enough?
Not quite. Without reliable customer service, all those marketing dollars are likely to go to waste. As soon as word spreads that your brand is hard to reach or unhelpful when problems arise, trust evaporates — and so does your customer base.
On the flip side, when you do invest in great customer service as an ecommerce brand, the rewards speak for themselves: more loyalty, higher conversions, glowing reviews, and sustainable growth.
Let’s break down why it matters.
Higher conversion rates
Conversion rates are a pain point for most ecommerce businesses, with the average hovering just above 5%. But excellent ecommerce customer service can give this number a lift:
Proactively surfacing helpful information — like tips on how to take measurements for the right fit — using tools like Help Scout’s Messages can go a long way in boosting conversions.
When potential buyers have questions about shipping times, return policies, or product details and get quick, helpful answers, they are far more likely to click that “Buy Now” button.
On top of that, great service leads to glowing reviews about your company online. Since 98% of shoppers check reviews before purchasing, those positive experiences can directly influence new conversions.
Brand loyalty and repeat business
According to PwC, customer experience matters more than traditional advertising for most U.S. consumers. That means your customer support team can have a bigger impact on purchasing behavior than your flashiest ad campaign.
When shoppers feel valued and supported, they are more likely to come back again and again. Over time, these repeat customers will have a significant impact on your revenue, and they often become vocal fans of your brand, spreading the word organically.
Positive word of mouth and referrals
There’s nothing more powerful than a happy customer telling their friends about your product.
We live in a world where trust in institutions — including businesses — feels like it’s in free-fall. Exceptional customer service creates unexpected “wow” moments that people want to share, whether that happens online or in face-to-face interactions.
Common customer service challenges for ecommerce teams
While the daily ticket queue of ecommerce support can throw anything your way, there are a few big challenges that just about every support team faces time and time again.
Here are the main ones I’ve seen across all of the ecommerce customer service teams I’ve helped start and scale over the last decade.
Seasonal volume spikes
Between Black Friday, Cyber Monday, and the countdown to Christmas, ticket volumes can skyrocket overnight.
Every team handles this differently. Some bring on seasonal contractors or outsource to support partners. Others adjust customer expectations by extending response times and being super transparent with customers.
There’s also the option of building a slightly overstaffed in-house team that can shift between customer support and non-urgent work (like writing product descriptions or updating help center articles) during the slower months.
However you tackle it, one thing is clear: holiday prep starts months in advance. And with shopping events popping up all year long (Valentine’s Day, Mother’s Day, Christmas in July, Prime Day, you name it), the calendar is starting to feel like one long warmup for peak season.
Product issues outside of your team’s control
Few things are more frustrating for an ecommerce support agent than trying to deliver a five-star experience when the product just isn’t holding up. Defects, quality issues, or inventory inconsistencies are often outside the support team’s control, but they have a direct impact on the customer experience.
What can you do?
Start by keeping a clear log of recurring product issues and regularly analyzing trends. If you’re dropshipping or selling third-party products, this kind of insight is gold — it can help your team advocate for better suppliers or even recommend switching to a more reliable production partner or white-label option.
At the end of the day, no amount of excellent support can make up for a poor-quality product. Fixing quality issues at the source is crucial for long-term success.
High return rates
Offering free returns is great for conversion, but some customers treat online shopping like a “buy now, decide later” game, especially in categories like apparel or home decor. When returns pile up, it creates a major workload for support teams and a hit to profitability.
Instead of tightening your return policy and risking a lower conversion rate, you can take a more strategic approach:
Identify your ideal customer profiles with the lowest return rates, and work with marketing to attract more of them.
Collect return reasons to understand why customers are sending items back, and work with your website development and product teams to address those issues proactively.
Optimize your product experience. For fashion brands, this could mean providing super detailed garment measurements or showcasing clothes on different body types. For other products, clear photos, videos, and honest descriptions go a long way in reducing “not what I expected” returns.
How to build a winning ecommerce customer service strategy
So, where do you start with building a customer service strategy that delivers great customer experiences and prepares your team to handle the challenges above?
It all starts with structure. Here’s how to lay the foundation for support that scales.
Start by documenting your SOPs
One of the best things you can do for your team (and your customers!) is to write down your standard operating procedures (SOPs). Start by answering these key questions:
What voice and tone should your brand use? This sets the stage for your help center content, macros, chatbot language, and even who you hire. Are you aiming for friendly and fun or professional and polished?
How flexible is your team with discounts or custom requests? Will you follow strict decision trees with AI and automation handling most inquiries? Or are you aiming for high-touch, personalized service with custom replies for each case (often the approach for luxury goods)? The right answer depends on your business model as well as support volume and resources.
What are your return, replacement, and exchange policies? Can orders be edited and, if so, for how long? What’s the step-by-step process for handling these requests?
As you write things down, you’ll likely uncover gaps, especially in customer-facing content. Anything that customers might want to know should live in your help center, not just your internal docs. You can use apps like Notion for internal processes and tools like Help Scout’s Docs for public help resources.
Define your response time goal and coverage needs
Ecommerce customers expect speed, and immediate replies matter to most of them (90%, according to HubSpot's research). Think about the markets and time zones you serve — what coverage do you need to meet expectations?
As a general rule:
Email responses should land within a few hours (and max out at 24 hours).
Replies via social media channels are expected within a couple of hours, if not sooner.
Live chat responses should come within minutes, or you’ll start seeing complaints.
To make this work without overhiring and hurting your bottom line, lean into AI automation and self-service tools. A smart ecommerce chatbot and a well-structured help center can deflect a ton of ecommerce customer service inquiries, keeping your human team focused and response times snappy.
Set up systems for collecting insights
If you're a team of one or just getting started, it’s tempting to focus only on replying to tickets. But without tracking and reporting on trends, it’s hard to scale, improve things, and make an impact over time.
Start small:
Tag conversations by topic, issue, or sentiment (AI tools can help automate this).
Log return and replacement reasons by product.
Use that data to identify product quality issues, common support topics, and operational gaps.
Something as simple as a Google Sheet can do the job if you're not using a voice of the customer (VoC) platform or haven’t yet automated returns with a tool that includes built-in analytics. The goal is to spot patterns to be able to make informed decisions as your business grows.
Choose the right KPIs for your ecommerce customer service team
No strategy is complete without a way to measure success. Plenty of common customer service metrics make sense to track when you’re leading an ecommerce support team, including:
CSAT (customer satisfaction score): How happy are customers with the support they receive?
CES (customer effort score): How easy is it for customers to get help?
First reply time: How fast does your team respond?
Resolution time: How long does it take to fully resolve an issue?
Tickets per order rate: How effectively are you surfacing policies and product information to customers, helping reduce unnecessary interactions?
Don’t overwhelm your team with a million metrics. Pick the ones that matter most, track them consistently, and use that data to drive improvements over time.
Ecommerce customer service best practices
Now that you’ve got your SOPs in place, your KPIs defined, and systems set up to track insights, it’s time to take your customer service to the next level.
The best practices below will help you deliver a top-notch ecommerce customer service experience.
Offer omnichannel support
Some customers still want to pick up the phone. Others expect instant answers via live chat. And many are more than happy to slide into your DMs or send a quick email. In 2026, offering support on just one or two channels simply isn’t enough — you need to meet customers wherever they are.
Thankfully, modern ecommerce customer service software makes omnichannel support easier than ever. For example, Help Scout lets you manage live chats, email, social media messages (via integrations with key platforms like Facebook Messenger and Instagram), and more — all from a single, shared inbox.
Why does this matter? Centralizing your channels improves team visibility, reduces response times, and ensures consistency across all customer interactions.
Within Help Scout’s shared inbox, you get access to powerful features like:
Workflows to automatically assign, tag, or reply to tickets
Saved replies for quick responses to common questions
Internal notes and collision detection to streamline internal collaboration and avoid duplicate replies
AI-powered agent assistance to help correct grammar, change tone, and reply faster
Help Scout also integrates with Shopify and other popular ecommerce platforms, so you can view and manage customer orders directly within the help desk — no tab-switching needed.
And when all your channels flow through one system, you also get access to insightful reports on ticket volume, team performance, and customer satisfaction, with all the important metrics in one place.


Invest in customer-facing FAQs
Many customers try to resolve issues themselves before reaching out for support, so give them the tools to succeed. Make sure your FAQs and help center cover the most common ecommerce questions, and surface this info in all the right places:
On product pages.
In your website’s dedicated FAQ or Help section.
In order, confirmation, and shipping emails.
Must-have topics include:
Product details, materials, sizing, and care instructions.
Shipping timelines and regions.
Return, refund, and warranty policies.
How to cancel or edit an order.
Take it a step further by regularly analyzing incoming support requests and updating your FAQs based on common themes. The more helpful your self-service resources are, the lighter the load on your support team.
Leverage AI to scale support
Ecommerce is one of the few industries where AI can already handle a significant portion of customer requests automatically, so if you’re not taking advantage of this, you’re missing out.
Once your help center is built out, you’re ready to roll out an AI-powered chatbot to handle common questions, share order updates, and provide after-hours support when your team is offline.
Tools like Help Scout’s AI Answers make this easy, as long as your knowledge base is optimized for AI:
Keep each article focused on a single topic.
Clearly state the question being answered in the title or the first paragraph.
Use consistent terminology that matches how your customers speak.
Beyond bots, AI can also help draft responses for tickets that reach your support agents. For more complex, lengthy conversations, tools like Help Scout’s AI Summarize feature offer major efficiency gains by quickly highlighting key details.
Provide multi-language support
Seventy percent of customers prefer doing business with companies that offer support in their native language. That’s a huge opportunity to build trust and boost retention.
If your ticket volume and budget allow, you can hire native-speaking agents or bilingual team members, especially in markets like South America (for Spanish/English language) or Europe, where multilingualism is common.
For smaller brands, full multi-language coverage might not be feasible — but AI has your back here, too. Many help desks, including Help Scout, now include AI-powered translations that are nearly indistinguishable from human responses and can be a cost-effective way to support international customers without hiring an army of agents.
Monitor and learn from customer reviews
Today’s customers want to be heard, and they want to hear from other customers, too. Customer reviews are a powerful source of insights for improving the overall customer experience, and they’re also a major factor in influencing purchase decisions.
Tools like Yotpo or Stamped make it easy to collect and showcase reviews, and more importantly, they give your team visibility into the full customer journey, allowing you to sort, filter, and save precious customer feedback. Analyze it to identify common themes, and use those insights to improve the customer experience or advocate for changes across other areas of the business.
For example, delivery issues are a common challenge in ecommerce. By analyzing reviews, you can tag which carriers are most frequently associated with complaints and evaluate whether it’s still cost-effective to rely on them or if switching to a more reliable provider makes more sense.
Knowledge is power, and tapping into customer feedback helps you make smarter, more customer-centric decisions.
Examples of companies delivering stellar ecommerce support
We all know Zappos set the gold standard for ecommerce service years ago, but plenty of other brands have also stepped up and built a name for themselves by delivering thoughtful, innovative customer experiences.
Here are three companies that are nailing it — and what you can learn from them.
Glossier: Omnichannel support with a personal touch
Glossier meets customers wherever they are — email, chat, DMs, you name it. Their customer experience team, known as the gTEAM, handles support across all channels and even jumps into social media comment sections to offer real-time help.


But they don’t stop at being highly responsive. Unlike many brands that view customer conversations as a cost to minimize, Glossier leans into them, seeing every interaction as a conversion opportunity.
Whether it’s answering questions in DMs or even hopping on FaceTime to chat about makeup, they meet customers where it makes the most sense and go the extra mile by sending personalized samples based on past purchases or specific skin concerns, turning every touchpoint into a mini brand moment.
Why it works: Glossier doesn’t just provide answers — they build relationships and meet customers where they are. By combining fast, omnichannel support with personalized recommendations, they create memorable experiences that keep customers coming back.
Zalando: Localized support for every market
Zalando, one of Europe’s leading fashion retailers, goes above and beyond by offering localized customer service across all of its target regions. From live support to help center content, Zalando ensures customers can get assistance in their native language, making it easy and accessible no matter where they’re shopping from.
Their product pages, FAQs, return policies, and order information are also fully localized and tailored to the languages and expectations of each market they serve. This level of personalization creates a seamless experience for customers across Europe, where language and shopping norms can vary widely.


Why it works: By localizing both their support and customer-facing content, Zalando is able to build trust, reduce confusion, and make international customers feel right at home.
ASOS: Helpful self-service resources with a clear path to human help
ASOS makes it easy for customers to quickly get help on their own. Their support center is well-organized, with a prominent search bar, categorized FAQs, and common questions listed right at the top. It’s a near-perfect example of a helpful customer-facing knowledge base.

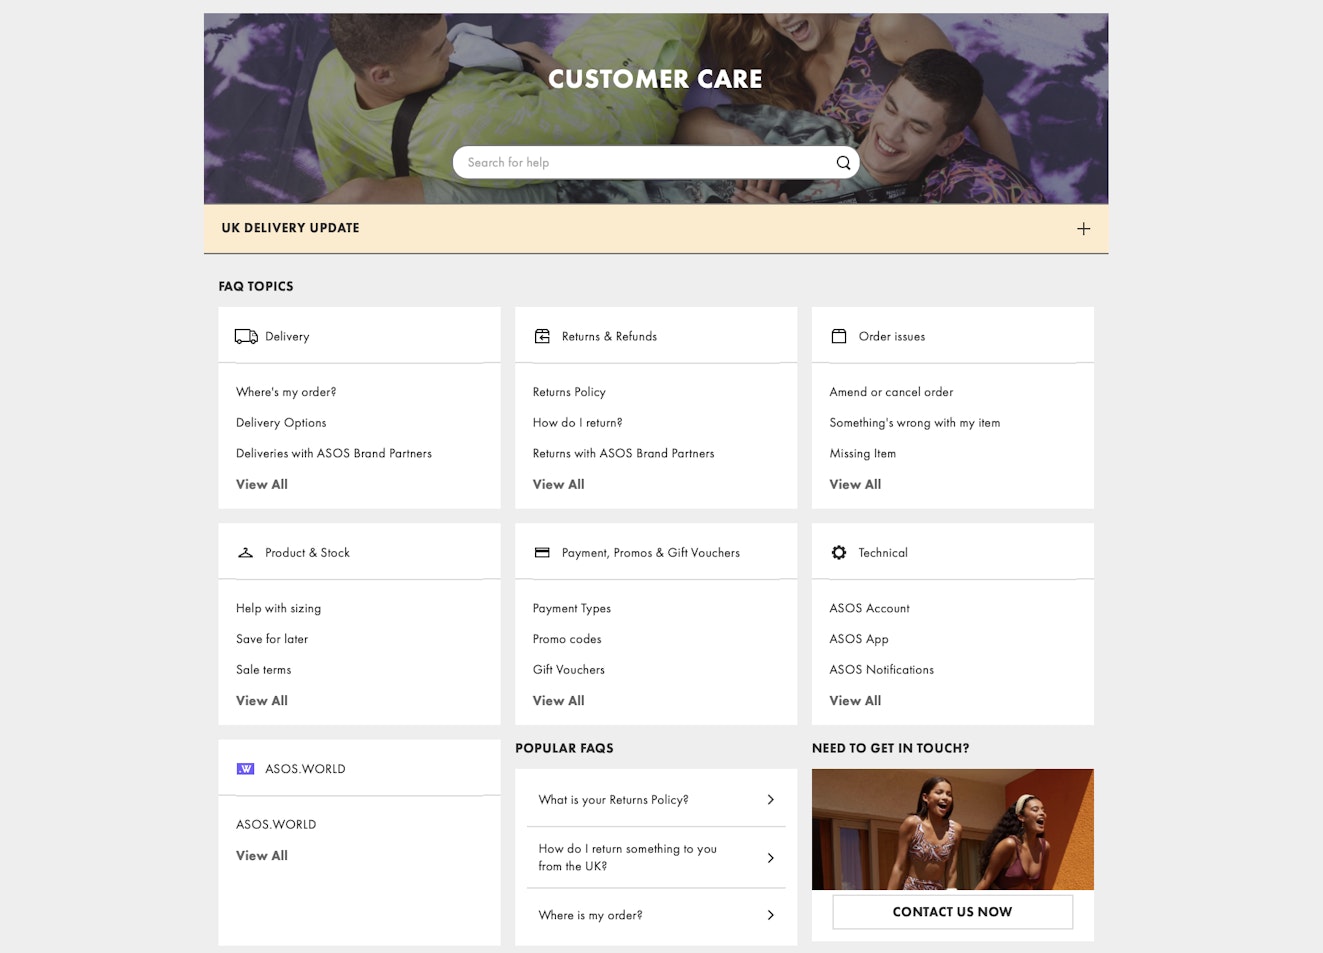
Beyond self-service resources, ASOS also clearly links to live support options, making sure customers can still get help if their issue is unique and isn’t addressed in the FAQs. They also keep service consistent across regions, tailoring experiences for global shoppers while keeping response times fast.
Why it works: ASOS strikes the right balance between efficiency, investing in self-service, and accessible human support. They respect the customer’s time while still showing up when it counts.
Improving your ecommerce customer service in 2026
As you continue to invest in marketing and grow your sales, don’t forget the power of keeping your customers happy, because the real magic happens when you turn one-time buyers into loyal brand advocates.
By putting the strategies and best practices in this guide into action, you can support your customers effectively while boosting customer lifetime value and turning support into a true growth engine.
Maryna Paryvai
Maryna is a results-driven CX executive passionate about efficient processes and human-centric customer support. With a track record of scaling ecommerce support operations, she firmly believes that exceptional customer experiences lie at the heart of every successful business.